


| Table of Contents |
|---|
| States Where Your Entertainment Dollar Goes the Furthest and Shortest |
| How Far Does the Entertainment Dollar Go in Your State? |
| Closing Thoughts |
| Methodology |
Are you one of those people who meticulously budget your needs while ensuring you have some extra cash set aside just for fun? Are you also someone who wonders where all of your money went because certainly you couldn’t have spent that much? You’re not alone and you may not realize it but where you live could be impacting those budgeted numbers quite a bit.
Whether it’s comparing tax laws, income levels, or just how expensive it is to live these days, not all parts of the country are as financially forgiving as others. That prompted us to take a look at some data and find out which part of the country Americans can be more at ease knowing they have a little more wiggle room with their entertainment dollars.
To find out where residents get the most bang for their buck, we created an index based on 10 different state-level data points on income, taxes, and cost of living. Our goal was to identify the regions where people have more financial freedom to spend on fun activities. Join us as we break down the best and worst states for stretching your entertainment dollars.
States Where Your Entertainment Dollar Goes the Furthest and Shortest

Whether it’s splurging on a night out or putting some money into your BetMGM account to play some online casino games, how far your entertainment dollar will take you depends on many factors. A big one could be where you live.
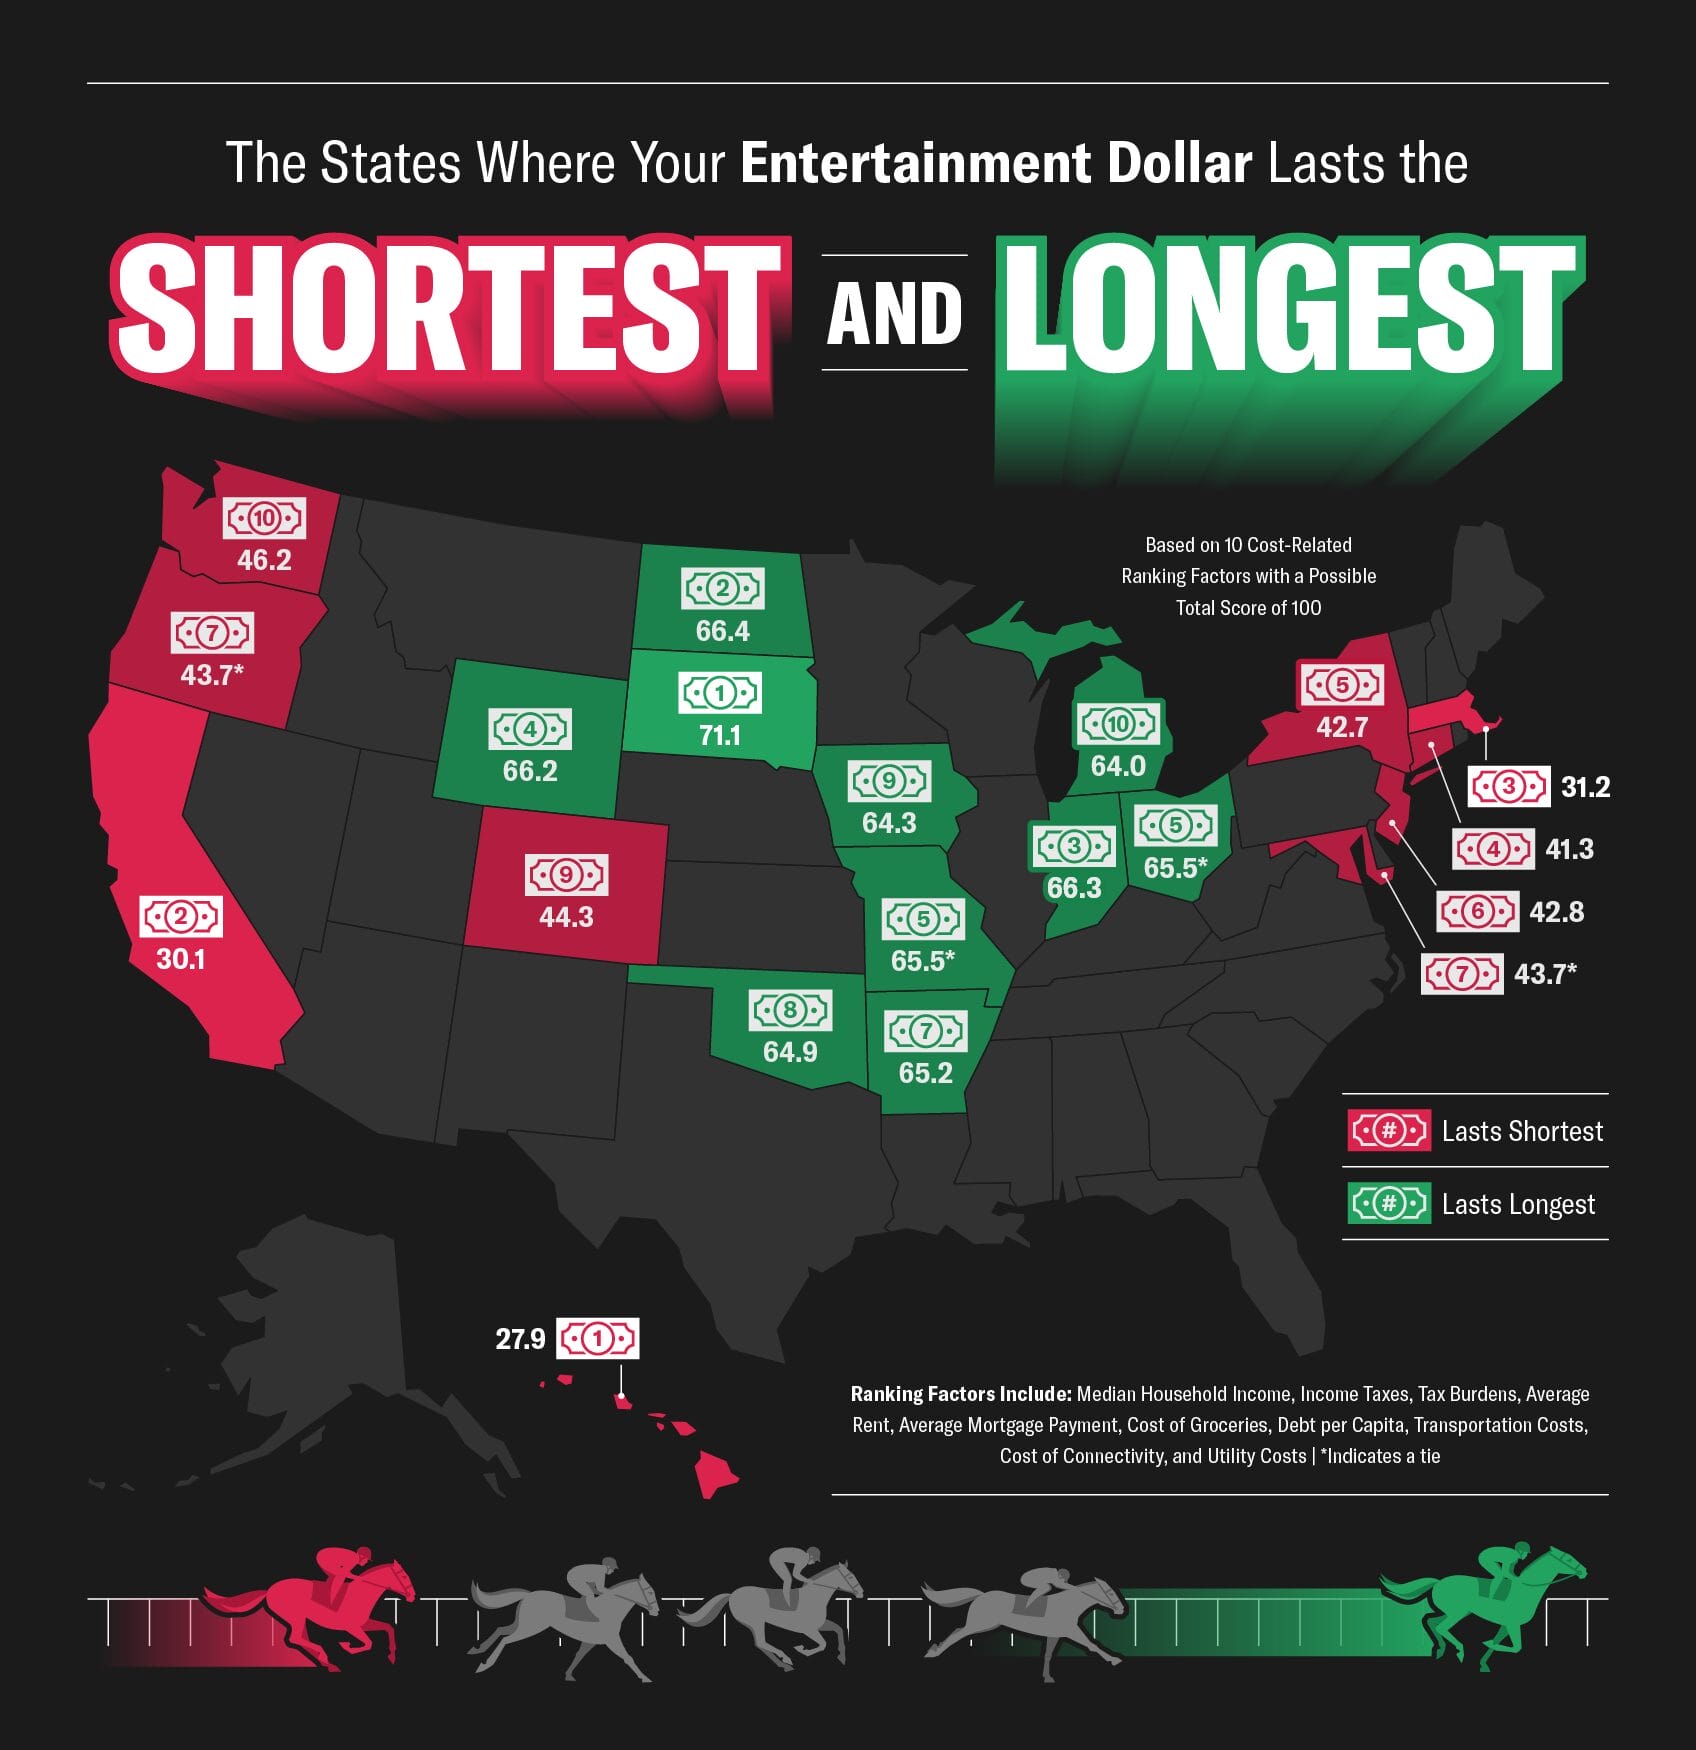
Our index, which takes different income and cost-related factors into account, scored every state from 0 to 100 with higher numbers indicating an area where residents can take their entertainment dollars further. First, let’s take a look at the places where your entertainment dollar will last the longest and a few reasons why that would be the case.
States Where Your Entertainment Dollar Lasts the Longest
- South Dakota – 71.13
- No state income tax
- Average annual cost of internet/mobile: $1,364 (14% less than national average)
- North Dakota – 66.43
- Average rent: $1,048 (34% less than national average)
- Average monthly utility costs: $310.59 (5% less than national average)
- Indiana – 66.27
- Average mortgage payment: $1,281 (26% less than national average)
- Average weekly cost of groceries: $239.11 (10% less than national average)
- Wyoming – 66.18
- No state income tax
- Tax burden: 7.5% (29% less than national average)
- Ohio – 65.49
- Average rent: $1,230 (23% less than national average)
- Debt per capita: $44,870 (22% less than national average)
Residents in some states, like South Dakota and Wyoming, benefit from no state income tax while others like North Dakota, Indiana, and Ohio see benefits from things like low housing costs. With more money in their pockets from smaller tax rates or lower costs of living, those living in these Midwestern states can see their entertainment dollars lasting.
States Where Your Entertainment Dollar Lasts the Shortest
While some states stretch your entertainment dollars, others make it a bit harder to spend on wants rather than needs. This time, we’ll focus on the states where residents’ entertainment dollars last the shortest. Let’s break down the data behind the states that rank lowest in our index.
- Hawaii – 27.86
- Average mortgage payment: $2,683 (56% more than national average)
- Average weekly cost of groceries: $333.88 (26% more than national average)
- California – 30.11
- Average income tax: 7.15%
- Average mortgage payment: $2,673 (55% more than national average)
- Massachusetts – 31.16
- Average rent: $2,714 (70% more than national average)
- Average annual cost of internet/mobile: $1,930 (21% more than national average)
- Connecticut – 41.33
- Average monthly utilities cost: $462.13 (42% more than national average)
- Tax burden: 15.4% (46% higher than national average)
- New York – 42.73
- Average income tax: 7.45%
- Tax burden: 15.9% (51% higher than national average)
In states like Hawaii, California, and Massachusetts, higher monthly mortgage and rent payments can reduce the amount residents have available for entertainment purposes. Similarly, residents in Connecticut and New York face more substantial tax burdens, resulting in less disposable income and tougher conditions for stretching their just-for-fun budget.
How Far Does the Entertainment Dollar Go in Your State?
Interested in how your state stacks up with the rest when it comes to how far your entertainment dollar can go? Search for your state directly or sort through the full data below to see where it lands. You’ll also get a look at what factors were considered for the ranking and just how far the gap is between the top and bottom states.
Closing Thoughts
Where you live can play a big role in how far your entertainment dollars can stretch. States like South Dakota and Wyoming offer more financial breathing room, allowing residents to enjoy more of their income on leisure activities. Meanwhile, states like Hawaii and California, with their higher basic living costs, make it tougher to splurge when you want to.
Understanding these regional differences can help you get the most out of your money. For those in more financially forgiving states, the excitement of online games at BetMGM provides a perfect way to spend those extra entertainment dollars. Whether you’re spinning the reels or playing a hand of blackjack, BetMGM offers thrilling ways to maximize your leisure time.
Methodology
To determine the states where your entertainment dollar lasts the longest, we evaluated every state based on 10 cost-related ranking factors that would impact how much someone can spend beyond their basic needs. A full list of ranking factors considered can be found below.
All the factors were equally weighted. The individual factors were given scores from 0 to 5 and summed to reach a total score of 0 to 100 with 100 representing the states where your entertainment dollar would last the longest. States with higher incomes and lower costs for necessities fared better in our ranking.
| Ranking Factor | Source |
|---|---|
| Median Income | Census |
| Income Taxes | Nerd Wallet |
| Tax Burdens | Tax Foundation |
| Average Rent | Rent Cafe |
| Median Monthly Home Payment | Business Insider |
| Cost of Groceries | Census |
| Debt per Capita | NY Fed |
| Transportation Costs | CNT |
| Cost of Connectivity | MIT |
| Utility Costs | This Old House |